Netdata was created because of a frustration that the COO, Costa Tsaosis, had while trying to pinpoint a performance problem using existing tools1. Because of the, according to him, shockingly small number of metrics and resolutions, he couldn’t pinpoint the problem. To fix this, he decided to create Netdata with the vision to provide high-fidelity infrastructure monitoring and performance troubleshooting, while keeping the system Open-source, free, preconfigured, secure, and easy to use. In addition to that, the system aims to be responsive with real-time data availability, providing every metric in less than one second. What makes Netdata unique in comparison to its alternatives (like Zabbix, Datadog, etc.), is that its available for free while providing similar or better performance.
Netdata is designed for system administrators, DevOps engineers, and developers to collect numerous data, help to visualize metrics, troubleshoot complex performance problems, and make data interoperable with the rest of your monitoring stack. As the clients know best what they need, Netdata believes it’s important to have people who are active in these fields to work on this tool.
Netdata can track all these metrics while having a low impact on the system, which gives the user more control over their systems and applications. With visualizations and alerts, Netdata puts real-time, granular information at your fingertips. Additionally, it notifies the user of likely anomalies, instead of simply providing all the metrics without any context. Netdata is designed to make the lives of IT pros, sysadmins, SREs, and developers better.
Domain concepts
Netdata several domain concepts, the most important ones are discussed below2:
The collection agent should be able to be run on many different platforms, without any issues, using a one-line setup. Among these platforms are almost all conventional Linux distributions, Container platforms, and other operating systems.
Netdata tracks and transmits any kind of relevant metric that the user might need in real-time, and comes with opinionated alarms and warnings, as well as complete user control allowing the user to add more alarms and responses to suit their specific needs. Netdata is expandable with plugins for gathering metrics from external sources, both commercial and Open-source. Netdata does this all at negligible load to the system, considering the granularity, speed, and number of metrics collected.
All data that has been collected in real-time by Netdata can be reviewed using the free proprietary Netdata Cloud visualizer, as well as streamed to other user databases through backend plugins. It can even be streamed to other Netdata agents over the network. All data can be accessed through various popular APIs and notification services or be stored in external databases.
Because Netdata is about remote monitoring, it is vital to prevent unauthorized access to the system and to any confidential data that might be exposed to the system. Netdata is designed with high security in mind and allows for complete isolation of the data stream from the internet, by never presenting raw data.
Main capabilities
An overview of main capabilities of Netdata2:
- Netdata can run permanently in physical/virtual servers, containers, cloud deployments, and IoT devices which makes the application easily transmissible.
- 1s granularity & Unrestricted number of metrics: Being able to collect all the available metrics while retaining the highest possible resolution for them.
- Netdata is optimized in terms of CPU utilization as it uses 1% of a single core and a few MBs of RAM. Because of this, Netdata is also highly scalable and can run on all your servers, containers, VMs, IoT devices, etc. Metrics are not centralized by default, so there is no limit.
- Easy to use, expansively configurable: You don’t need to configure anything, and can simply install and run it with a single command.
- Interactive visualizations of the metrics. The dashboard responds to queries fast, taking less than 1ms per metric to synchronize the charts as you pan through time, zoom in/out on anomalies, etc.
- Netdata has several operating modes. The default modes are autonomous host monitoring, headless data collector, forwarding proxy, store and forward proxy, and central multi-host monitoring. All these modes use different metrics retention policies per node and run with or without health monitoring.
- An upcoming feature which is under active development, is the addition of unsupervised anomaly detection through machine learning3. This feature will raise an alarm if a metric is not behaving as expected within a specific rolling window of time, even when within the alarm bounds.
Context
To see in what context Netdata operates we need to take two aspects into consideration: The users and dependencies.
Users: We strongly believe that there is no specific type of user that uses Netdata. The system is built in a very user-friendly way, allowing anyone to easily benefit from the system.
- Most users won’t use Netdata for the same purpose. Developers/data scientists could use it to monitor the performance of their CPU/GPUs and see how optimized their code is according to the metrics, a hobbyist may want to track their various Raspberry Pi projects, or an IT department might want to track peak server load impacts.
Dependencies: When it comes to Dependencies, Netdata works with a lot of different applications, notifications platforms, and other time-series databases.
-
300+ system, container, and application endpoints2: Collectors auto-detect metrics from default endpoints and immediately visualize them into meaningful charts, designed for troubleshooting. For example, Netdata has the APIs to monitor Docker, Kubernetes, Prometheus, Bind 9, CoreDNS, and even SNMP enterprise.
-
Netdata offers notifications on external platforms when an anomaly is detected in the system. These notifications are relayed to the user via for example: email, Slack, PagerDuty, Twilio, Amazon SNS, Discord, etc.
-
Netdata allows you to export metrics to external time-series databases using the exporting engine. This system uses several connectors to initiate connections to more than thirty supported databases, including InfluxDB, Prometheus, Graphite, ElasticSearch. Exporting data is an important part of Netdata’s effort to be interoperable with other monitoring software.
Stakeholders
Netdata has a large user base and therefore has a lot of different stakeholders. All these stakeholders have different intentions when it comes to using Netdata. The main stakeholders for this project are the Netdata company, investors, enterprise customers, and private customers.
The main stakeholder of this project is the Netdata company itself. Netdata company is a venture-funded company whose main aim is to build the best single-node monitoring system. The main goal of the Netdata company is to create exceptional software, and not to earn lots of money. The company does plan to add some paid functionalities to their Netdata cloud service, to offer better support to enterprise companies4. Besides this, the Netdata company has decided that most developer efforts will remain focused on the core, free, functionality of Netdata. Lastly, the Netdata company also manages the GitHub repository, where employees of the company review and approve all pull requests and have a final say in all architectural decisions.
Other stakeholders are the investors5 who supply the money Netdata uses for its development since Netdata is a venture-funded company. This money allows the company to hire full-time developers and speed up its development process. The exact stakes for these investors could not be found, but if we had to guess we would say that they (or some company that they own) use Netdata and they want to speed up the development process.
Lastly, there are the enterprise customers and the private customers as stakeholders. Starting with the enterprise customers, these are companies like Amazon and Google who use Netdata in their company to save or make money. Private customers are people who use Netdata to monitor their own systems. Some of these people might even contribute to the project by reporting bugs, solving bugs, even adding new functionalities.
Key Quality Attributes
Functionality: Key aspects of Netdata are that it should provide configuration less, immediate monitoring, without affecting other programs running on the same host6. The figure below displays the functionality of Netdata, showing the steps that are followed during metric collection. Using this picture, it becomes clear that all metrics are collected every second and then visualized in less than a millisecond.
Figure:
Netdata functionality

Cost: The most important aspect of Netdata is that it is, and always will be, free to use for everyone4. Netdata company has chosen to keep Netdata free forever, as this is part of their vision.
Security: The raw data that is collected by Netdata never leaves the host’s system. All raw data that is collected by Netdata is always transformed into a metric before it gets stored into a database or send to the Netdata servers. Therefore, the raw data never leaves the hosts system, allowing Netdata to be used in systems with the highest level of data isolation7. Next to this, no special privileges are required to run Netdata, allowing it to run as a normal system user. Netdata company also provides guides to further protect your data, and, in the case of Netdata Cloud, they also provide instructions on how to protect your nodes8.
Scalability: Netdata should be scalable, this can be interpreted in two ways. Firstly, Netdata should be scalable in the sense of metrics, here possibly hundreds of new metrics might be added by anyone willing to contribute to the project. Secondly, the number of systems (also called nodes) connected to the Netdata cloud should be scalable9. Here an infinite number of new nodes should be able to be added to the overview, allowing easy monitoring of multiple systems. An example of such a list of nodes can be seen in the picture below.
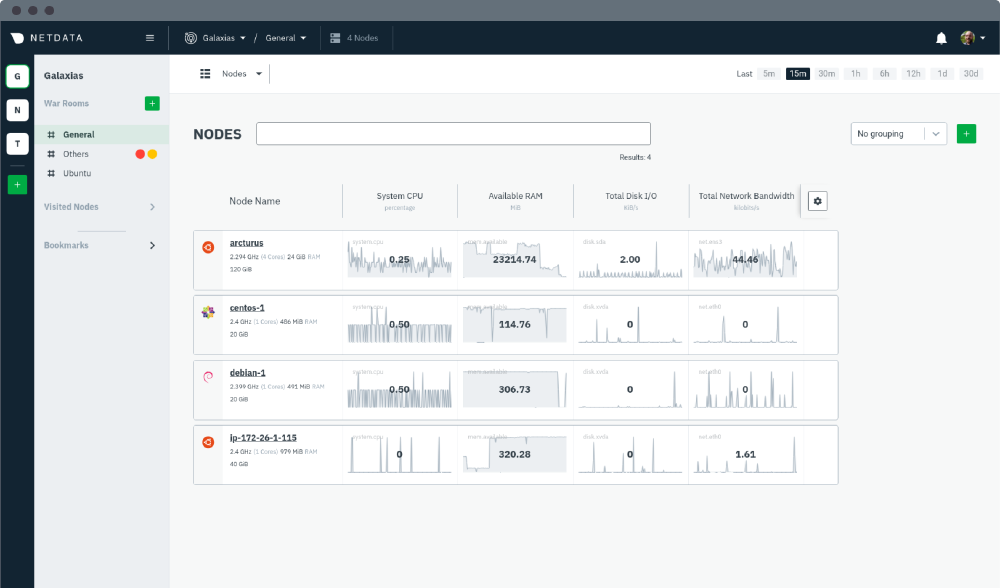
Figure: Netdata Cloud nodes list
Product Roadmap
Netdata mainly focusses on near-future improvements to the core functionality of the system, such as adding more integrations, maintaining minimal system load, and adding improved automated alerts. The next major feature that will be added, is scheduled as part of their quarter 1 goal. This will be the slow rollout of the Machine Learning suite, which would allow Netdata to track expected value ranges for normal operating procedures and automatically generate warnings for anomalies, which indicate a significant change in the observed system. We estimate that the growth of Netdata relies on maintaining and improving the key quality attributes, while integrating new plugins, APIs, improving the backend design for the Cloud platform, and expanding the community.
Ethical considerations in the Netdata architecture
Privacy: Netdata does not store any of the collected metrics, these metrics will always first be transformed before their visualized or transported. Furthermore, Netdata offers various security options to users that do not wish for sensitive data to be accessible to malicious actors8, by encrypting the data stream between the monitoring agent and the cloud. Additionally, it allows users to opt-out of any of the usage statistics it tracks.
Security: Netdata has clearly defined roles for the collection plugins, which are hardcoded to only collect relevant metrics. Netdata needs no additional privileges to run, and its dashboard interface acts as read-only, so it cannot be used to alter the collection behavior in any way10.
Upholding product ideals: Keeping all Netdata’s monitoring solutions freely available to everyone is not enforced by its software architecture, but instead it is a commitment made by the company. They have also made clear that Netdata, at its core, should be an easy-to-pick-up monitoring tool, that is made with the IT community in mind. Netdata should also actively encourage IT professionals to get involved and contribute their expertise, on the various suites and alarms, to the project.
References
-
How Netdata rewrote the rules of monitoring and troubleshooting https://www.netdata.cloud/about/ ↩︎
-
Netdata readme GitHub https://github.com/netdata/netdata/blob/master/README.md ↩︎
-
Maguire, A. Machine learning (ML) powered anomaly detection https://learn.netdata.cloud/guides/monitor/anomaly-detection ↩︎
-
Tsaousis, C. (2020, July 29). Why Nedata is free https://www.netdata.cloud/blog/why-netdata-is-free/ ↩︎
-
Netdata investors https://www.crunchbase.com/organization/netdata ↩︎
-
Tsaousis, C. (2019, December 19). Redefining monitoring with Netdata (and how it came to be) https://www.netdata.cloud/blog/redefining-monitoring-netdata/ ↩︎
-
Security design (2021, December 13). https://learn.netdata.cloud/docs/agent/netdata-security ↩︎
-
Secure your nodes. (2020, April 1). https://learn.netdata.cloud/docs/configure/secure-nodes ↩︎
-
Netdata Cloud. https://www.netdata.cloud/cloud/ ↩︎
-
Your system is safe with Netdata. https://learn.netdata.cloud/docs/agent/netdata-security#your-systems-are-safe-with-netdata ↩︎