Introduction
In his paper 1, André B. Bondi introduces the terms structural and load scalability as follows: “Structural scalability is the ability of a system to expand in a chosen dimension without major modifications to its architecture. Load scalability is the ability of a system to perform gracefully as the offered traffic increases”. In the following sections we analyze the structural scalability of Wireshark by focusing on its core, as well as dissectors and Lua API2, while the load scalability and power usage is studied by measuring Wireshark’s performance under a (simulated) high network throughput, and the effect of memory leaks on the space is considered at the end.
The Core
Wireshark developers describe the core as the “main ‘glue code’ that holds the other blocks together” 3. Together with several other function blocks within Wireshark, the core source code can be found in the root directory of the Wireshark project. Since Wireshark lacks further documentation about its core 4, it is up to the developer to find out which files in the root directory belong to the core.
The core holds all function blocks together, for both adding and replacing function blocks the core code needs to be edited. Keeping scalability in mind, we would recommend Wireshark to further document this component. Furthermore, another suggestion would be to place all loose function blocks (including the core) in a separate folder rather than in the root directory of the Wireshark project.
Protocol Dissectors and Lua API
Wireshark provides a dedicated dissector for every communication protocol it supports, and, as of March 2022, Wireshark offers 1549 dissectors which is a significant amount that lets us ponder on the scalability of the architecture implemented by Wireshark and how simple it is to add new dissectors along the existing ones. As we discussed in our previous posts, the “Enhanced Packet ANalyzer” (epan) component of Wireshark contains the dissectors, display filters and protocol tree. When dissectors for a new protocol are added, they will be embedded in a dedicated file and referenced in the protocol tree. As a result, the epan grew substantially over time and it is by far the largest component in Wireshark. The epan contains 2202 packet dissector related files at the time of writing, which increases difficulty in maintaining and scaling up with new dissectors, as it becomes harder to manage and dependencies become less obvious. On the other hand, scaling down can be achieved by removing a dissector’s functionality and corresponding file, in case a protocol becomes obsolete. To ease the process of scaling up, we propose dividing the epan into multiple modules based on the existing network stack layers of the TCP/IP model. As such, there could be a module for each of the following layers: application layer, transport layer, internet layer, and the network access layer as indicated in the figure. Therefore, the epan would be more structured with the introduction of a new layer of abstraction, files would be easier to manage and would have a clearer separation of concerns.

Figure: Proposed structure of Wireshark’s protocol dissectors
Additionally, Wireshark keeps a lot of its core functionality available through the Lua API2, including saving capture files, obtaining dissection data, GUI support, functions for new protocols and dissectors, binary encode/decode support, GLib regular expressions, as well as other packet dissection related features. Therefore, the codebase is quite scalable in the sense that new features and functionality can be included within the API and made available to the other components of Wireshark in a sustainable and organized manner. One example could be the option to configure Wireshark to dump captured packets into a local database as opposed to pcap files, or save them in a remote database using HTTP POST requests to allow storing large amounts of packet data. Such a feature would be useful for monitoring a network, however, Wireshark recommends using other tools for such purposes, since it was not designed with monitoring in mind, but rather debugging and analysis5.
Time performance and Energy
An important caveat regarding Wireshark’s performance is the fact that it is difficult to experiment with high network throughput. This is because running Wireshark on public networks, while not technically illegal, is not ethical to do without the network administrator’s consent (which they might be reluctant to give), and home networks can only produce so much traffic. In order to simulate this, Wireshark was run on a home network for a period of 8245 seconds (2.3 hours), capturing a total of 577213 packets.
In the following, measurements regarding CPU, Memory, Disk, and Power usage are according to the Windows Task Manager. A visual of what this looks like is provided in the figure below.
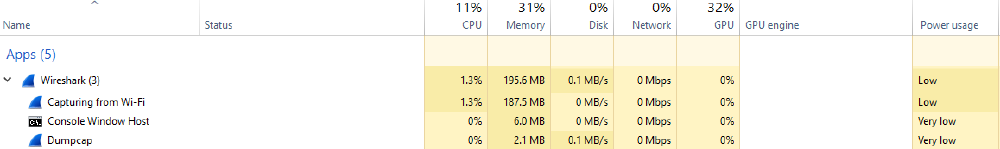
Figure: View from Windows Task Manager of Wireshark running on home WiFi
While capturing:
- CPU usage is between 0% and 2%, usually revolving around 1%;
- Memory does not change quickly, but grows over time, as more are more packets come in; from this, we can deduce that the packets are stored in RAM while the Capture subroutine is running;
- Dumpcap is constantly using the disk at 0.1MB/s;
- Power usage is “Very low”. After capturing:
- Size of the capture file is 644 MB;
- 676.3 MB memory being used. While filtering:
- CPU usage jumps to 16.4%;
- Power usage is “Very high”, while Wireshark is applying the filters, while CPU usage jumps to 16.4%.
Additionally, filtering was also investigated from the response time point of view:
- filtering on tcp - 4.99 seconds;
- filtering on tcp and specific source ip - 5.68 seconds;
- filtering on tcp and specific source ip after having filtered on tcp - 5.6 seconds ;
- filtering on tcp and specific source and destination ips - 5.9 seconds;
- filtering on tcp and specific source and destination ips after having filtered on tcp and specific source ip - 5.83 seconds.
It seems like the whole file is rescanned again, even if the filter requests a subset of the packets that Wireshark is already displaying. The suggested change is to store the result of the initial filter in the memory and use it as the starting point if the new filter is on a subset of the initial one.
While checking the statistics pages about the packets, a few observations worth noting are given in the following. Even for a “relatively small” number of packets (half a million), the “Flow Graph” page takes about 15 seconds to generate (to the point where Windows considers the process unresponsive for a bit). The page itself is difficult to scroll through, as it moves very slowly. Even scrolling “only once” by clicking the arrow on the scroll bar causes the CPU usage to spike to 20% and the power usage to go to “Very high”. This is likely because the entire flow graph is being processed, even if only a small part of it is visible on the screen at any given time. Other pages have this similar issue, although to a smaller, less noticeable degree.
A possible improvement could be to modify the user interface code such that only the elements that are displayed on screen are being processed, to make the page smoother. Another suggestion is enabling the display of the filtered packets when loading the page. Some of the statistics pages have checkboxes for analyzing only the filtered packets, but this checkbox is not ticked by default. It is safe to assume that, since the user already filtered the packets, they are interested in those packets only, so ticking the box by default should save some time, processing power, and energy.
A diagram visualizing the suggestion for the filters is given below.
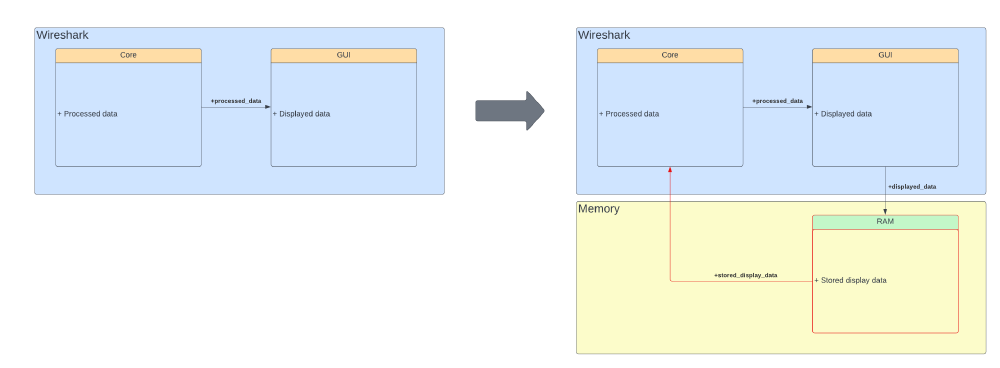
Figure: Proposed changes for filtering
The proposed changes were tested by saving the packets manually after filtering and measuring the time again. The results are presented below:
- filtering on tcp and specific source ip after having filtered on tcp - 1.65 seconds (previously 5.6 seconds);
- filtering on tcp and specific source and destination ips after having filtered on tcp and specific source ip - 0.4 seconds (previously 5.83 seconds);
- the “Flow Graph” page generated in about 4 seconds, when the tcp filter was applied, and in about 1 second when the specific source ip was also applied.
This shows that filtering on a subset of the original filter, as well as displaying the statistics, can be made faster, by using intermediate results. However, the power usage still spikes to “Very high”, even for a lower number of packets, which indicates that the filtering method itself could also be improved.
In this regard, it is also worth noting that Wireshark itself implements a feature that could help. The application distinguishes between capture filters and display filters 6. By using CaptureFilters, only packets that fit the filter criteria are kept, so those are the only ones loaded in the user interface (thus requiring no filtering), as well as in the statistics (leading to faster processing of these pages).
Space performance
Another possible barrier to the scalability of Wireshark is the growing problem of memory leaks in the Wireshark application, which might also contribute to the growing memory usage as seen in the previous section. Since Wireshark is an extensive application that aims to capture vast amounts of network data over a period of time, small memory leaks in one of the components can quickly lead to significant memory leaks. On the Wireshark Gitlab, many issues can be found relating to both main and secondary memory problems with different components of the application 7 8 9 10. Since network speeds and the quantity of network data is likely to increase in the future, these problems could form a considerable obstacle to the future development and scalability of Wireshark.
In issue #17776 posted on the Wireshark Gitlab 7, a quantitative example is provided on the effects of such a memory leak. Wireshark was run using the GRPC component. The figure below was created by the author of this issue and it demonstrates that over 12 hours, the memory usage linearly increases by 0.5 GiB per hour.

Figure: Possible memory leak in GRPC
this can be compared to the following figure, created by the same author of the issue. Here the same network data is collected without the GRPC component.

Figure: Usual memory usage
It looks like there could be a memory leak in the GRPC component. This specific example quantifies the possible issue with memory leaks rather well. This is just a single component and does not significantly impact Wireshark as a whole. However, as the application keeps growing and network traffic keeps increasing, this might affect the scalability of Wireshark in the long run.
In general, software components can be tested for memory leaks rather easily. The problem of memory leaks probably does not originate in the core of the application. Some architectural choices do contribute to this problem. Especially the choice to provide a dissector for each supported communication protocol leads to many smaller components which all need to be tested. This is particularly relevant since it is encouraged that users add dissectors to Wireshark.
To address this issue, changes could be made as proposed in the previous section that specifically adresses dissectors or testing could be increased further. This architectural structure also has positive effects on scalability since it is easy to add new dissectors that increase the number of communication protocols supported. Since this is a crucial feature that is at the core of Wireshark’s success, changing the architecture of Wireshark to address memory leak issues is likely not a viable option. However, tougher testing policies with regard to memory usage might have to be enforced as network speeds and data transmissions keep increasing.
Conclusion
In this paper, it becomes clear that even though Wireshark is generally a well-designed application. Some challenges still remain for the scalability of the application. Some choices made to the architecture to promote customizability and user adoption might pose issues in the future. These include the core design, protocol dissectors, the Lua API, throughput, package size, and memory leaks.
References
-
André B. Bondi. 2000. Characteristics of scalability and their impact on performance. In Proceedings of the 2nd international workshop on Software and performance (WOSP ‘00). Association for Computing Machinery, New York, NY, USA, 195–203. DOI:https://doi-org.tudelft.idm.oclc.org/10.1145/350391.350432 ↩︎
-
Wireshark. Chapter 11. Wireshark’s Lua API Reference Manual. Retrieved March 9, 2022, from https://www.wireshark.org/docs/wsdg_html_chunked/wsluarm_modules.html ↩︎
-
Wireshark. Overview. Retrieved March 27, 2022, from https://www.wireshark.org/docs/wsdg_html_chunked/ChWorksOverview.html ↩︎
-
Wireshark. Design. Retrieved, March 27, 2022, from https://gitlab.com/wireshark/wireshark/-/blob/master/doc/README.design ↩︎
-
Wireshark. Overview. Network Troubleshooting: An Overview. Retrieved March 28, 2022, from https://wiki.wireshark.org/NetworkTroubleshooting/Overview ↩︎
-
Wireshark. CaptureFilters. Retrieved March 27, 2022 from https://wiki.wireshark.org/CaptureFilters#capture-filter-is-not-a-display-filter ↩︎
-
Wireshark Gitlab. Issue 17776. Retrieved March 27, 2022 from https://gitlab.com/wireshark/wireshark/-/issues/17776 ↩︎
-
Wireshark Gitlab. Issue 17901. Retrieved March 27, 2022 from https://gitlab.com/wireshark/wireshark/-/issues/17901 ↩︎
-
Wireshark Gitlab. Issue 17998. Retrieved March 27, 2022 from https://gitlab.com/wireshark/wireshark/-/issues/17998 ↩︎
-
Wireshark Gitlab. Issue 17127. Retrieved March 27, 2022 from https://gitlab.com/wireshark/wireshark/-/issues/17127 ↩︎