This second essay describes the way that Netdata transforms its vision, which we described in Essay 1, into an actual architecture.
Main architectural style
Netdata’s main architectural style is a component-based, data centric style. Netdata can be split up into multiple components, as can be seen in containers and components view below. Next to this, Netdata’s main functionallity is collecting and transforming data, making the data its primary asset. Looking at the picture below, we can see that Netdata has multiple external dependencies/actors. Netdata collects the data from these systems and then provides the user with an aggregated and personalized overview of the collected data. In addition, Netdata can also alert the user when certain metrics exceed a threshold and it supports over 30+ databases1, where the collected data can be exported to. These thousands of per-second metrics can be resampled at a user-configurable interval and exported to multiple time-series databases simultaneously.

Figure: Netdata Context View
Containers view
Diving deeper into the architecture, we can see that Netdata consists, as can be seen in the picture below, out of three major containers. The first container is the Data collection container, which collects all the data from the systems that needs to be monitored. To get this done, Netdata provides over 300 collectors2 that are in its base installation. The primary job of these collectors is looking for exposed metrics at a pre- or user-defined endpoints, gathering exposed metrics and using additional logic to build meaningful, interactive visualizations. This data will then be sent to the internal database, which resides in the Metrics database container. The User Interface container provides interactive visualizations of metrics. Next to this it also gives notifications and alerts when anomalies are detected or when certain metrics reach a threshold.
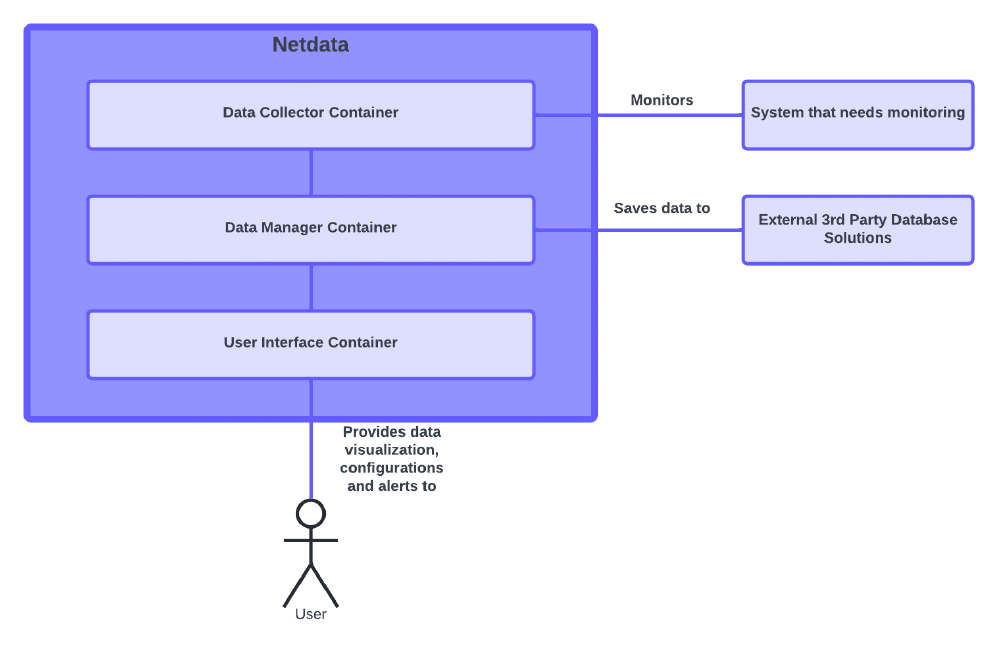
Figure: Netdata Context View
Components and Connectors
Moving one more layer down, we can see that the architecture of Netdata exists of many distinct modules, from these we have selected the key modules. These key modules could clearly be separated and had clearly defined data and request interfaces, as can be seen on the picture below.
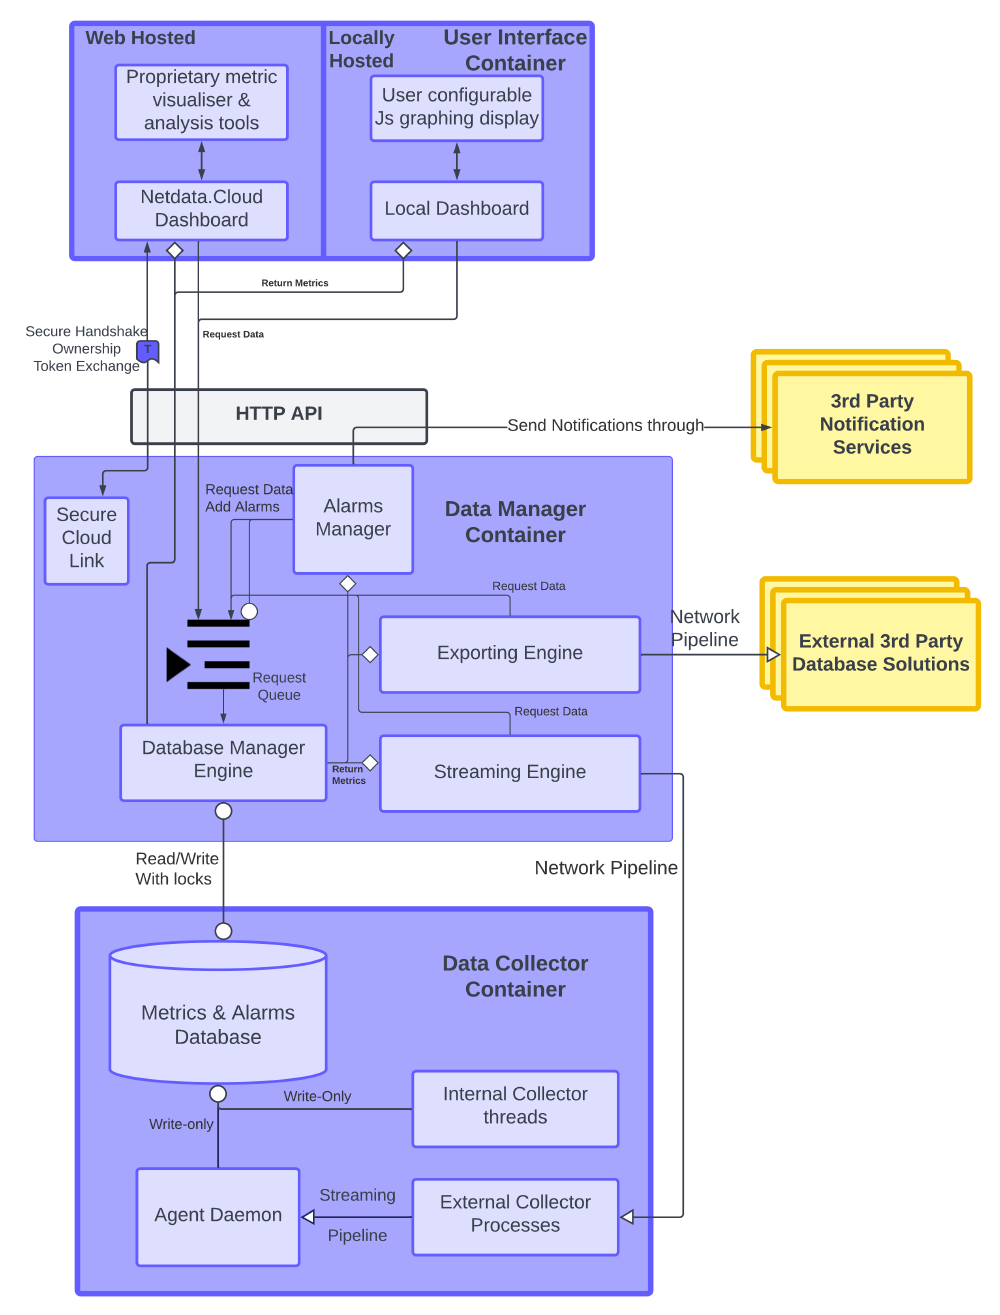
Figure: Netdata Software components and their connections
Agent Daemon The agent daemon starts all other threads and calls them, together with the engine components, to achieve the core collection purpose. Every collector has two primary jobs: 1) look for exposed metrics at a pre- or user-defined endpoint, 2) gather exposed metrics. These gathered metrics are then sent to the database engine for storage and retrieval.
Internal and External Collectors Internal plugins gather data from available kernel sources and spawn as threads from the Netdata daemon. External plugins gather data from external processes and run as independent processes that communicate with the Netdata daemon via streaming pipes. These plugins are grouped and managed by orchestrators, which each manage a group of plugins of a specific language (e.g., python orchestrator for python plugins).
Database Engine Collected data can be written to the database by the collection source, but reading and managing the database is done by the Database Engine. We have decided not to treat this as a shared database connector because the dimension and grouping of each metric is managed by this engine instance, and read requests only go through its thread.
Health and Alarms thread The health thread checks incoming metrics against pre-configured alarms while they are stored with the Database engine. Alarm occurrences are also written back into the database. Also, notifications can be generated because the thread calls an alarms-notify.sh script, which can be configured to send notifications through external plugins along with the generated alarm info.
Exporting Engine The exporting engine acts as an intermediary between Netdata’s internal database and a broad selection of external database engines. This converts the data into the correct format and connects it with the right web interface. It automatically requests info from the Database Engine, averaging data when the exporting updates are less frequent than the Netdata collection rate, and it repackages data for the configured export targets.
Streaming engine The streaming engine supports data and alarm streaming from one Netdata child node to a parent node, when ‘parent’ and ‘child’ nodes are configured as receiver and sender respectively. Data streams may be compressed before sending and the connection can be fully encrypted. Data received at the parent is accessed as though it were another metric to be collected.
Local and Cloud dashboard The Netdata dashboards form the GUI that an end user may choose to interact with. Cloud dashboards are hosted on Netdata’s servers, are connected using the Agent Cloud Link, and store the metrics (not raw data) of linked nodes to give a full system overview online. The local dashboard is a small webpage that can be hosted on the client node to immediately view that nodes output. Both use a JavaScript dashboard to visualize metrics requested through the HTTP API from the local database.
Agent Cloud Link This thread manages the handshake to the Netdata Cloud interface, including the secure connection, encryption, key exchange, and allowing to link nodes. This dependency for the HTTP API allows remote connection to a node, but not to the local dashboard.
Connectors There are 4(+1) types of software connector that Netdata uses at runtime:
- Direct and indirect function calls for inter-thread
- Unidirectional streaming pipelines (internal or networked) to export data streams to databases and parent nodes and from external collectors
- Web queries to interface between the database and dashboards,
- A request queue for the database manager for read/write requests from other components.
- Although we consider the database engine as a component, a shared database can also be considered as a connector in which case this would be the 5th type of connector listed here.
Development view
The image below displays the structure of the source code, as it is currently3. It is divided into folders, each of which is a module. Inside each folder, there are subfolders and files.
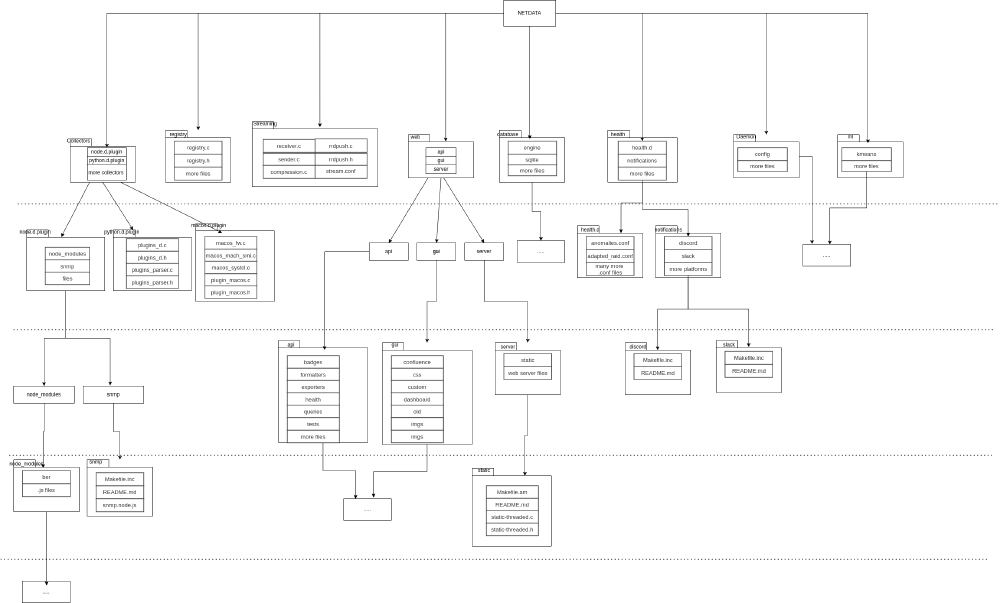
Figure: Netdata Development View
Since there are a lot of modules in Netdata’s repository we have decided to only include some of them, such as the connectors, database, streaming engine, etc. into the development view. In addition, we added the text “more files” to some folders, indicating that this folder has many files (any type of files e.g., code, readmes, confs, etc.) inside them. Finally, some modules were left out of the diagram, which is indicated by “…”. All of this was done to keep the diagram as readable as possible, while still showing the main modules and their dependencies.
Run-time view
The run-time view gives an impression on how components interact with each other during run-time and what dependencies are consequential. While the previous section described how components interact with each other from a development point of view, this section describes the interaction between different components in terms of run time according to the source code. A typical application scenario is to start a Netdata agent on your local machine (in a high-level overview), which is shown in the figure below.

Figure: Runtime view
- The user installs Netdata using the installation script.
- The user starts the Netdata agent.
- The daemon will start the threads, collectors, and the intermediate database (exporting engine).
- The exporting engine will convert the data to the right format, it will configure the dashboard and then it will store the metrics in the database.
- The user can open the dashboard (on localhost port 19999) and do queries to visualize the metrics and get insights on the system.
Key Quality Attributes
The previous essay discussed the four key quality attributes of Netdata: functionality, cost, security, and scalability. Here we will show how the architecture of Netdata enforces these attributes and solves any potential trade-offs.
Functionality: Netdata advertises itself as being incredibly optimized, allowing the collection of hundreds of metrics, within a few milliseconds, with low CPU utilization, and without affecting other programs on the same host. Here a trade-off between the resolution of metric collection and a low CPU utilization is solved by the architecture, by automatically balancing these two factors. Next to this, priority is automatically given to other programs on the host, making sure it does not affect these programs. Netdata uses Golang4 for their data collectors, allowing for data collectors that are compiled directly to machine code. Lastly, Netdata also provides a performance guide5, where it shows how the architecture can be reconfigured for lower power devices.
Cost: Netdata is available for free, which is not something that is realized by the architecture. This is however realized by the Netdata company6, who uses investors to fund the development of Netdata.
Security: Netdata offers the highest level of security, where a trade-off between the amount of detail of the data and security is solved by the architecture. Within the Netdata architecture different hard coded plugins are used for data collection, which do not allow any input from the outside. The raw data that is collected by these plugins will never be exposed, as all raw data is first processed before it is presented to the user, saved in a database, or send over the network7. Within the Netdata architecture, security is chosen over complete data insight, which we think was the right choice.
Scalability: Netdata is scalable in two ways. First up, Netdata’s architecture allows the addition of data collection from new sources, which only requires the implementation of a new module. For this, a module template (interface) is provided, which contains the methods that need to be implemented. Next to this, the new module only needs to be added to a few config files, and the data collection can start8. Secondly, Netdata Cloud allows for the scalability of the number of nodes, connecting multiple Netdata monitoring agents and visualizing their data.
API design principles
Netdata offers a REST API, which allows users to collect basic information about their Netdata agent. This includes things like status reports, alarm statuses, active collectors, etc. The API only allows the retrieval of information, it does not allow making any changes. The following design principles are applied:
OpenAPI specification 3: The Netdata API makes use of the OpenAPI specification version 39, which defines a standard on how the API should be structured. It defines clear rules on how endpoints, and response data should look.
Few/small interface principle: There are only thirteen endpoints defined in the Netdata API, which are all GET endpoints. These endpoints can be used to get information from the monitoring agent. These interfaces can almost all be used without the use of any parameters and return only a small specific part of information.
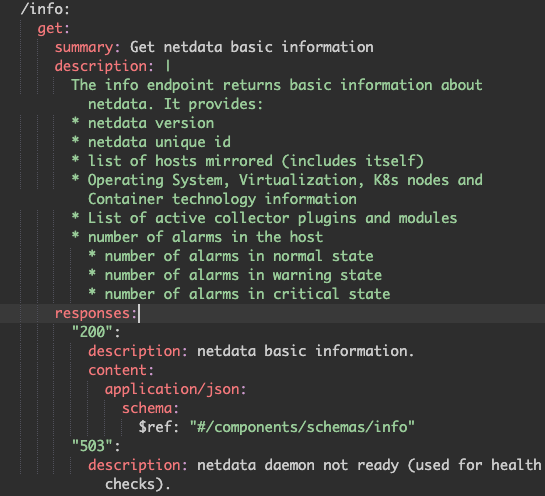
Clear interface principle: The interfaces are extensively defined inside the API documentation10. As can be seen in the figure below, all inputs, outputs, and possible error messages are presented.
Figure:
Netdata API info endpoint description
Uniform access principle: The data from the API is uniformly accessed11, meaning that the behavior of the endpoints does not change whether the data is a simple value or computed.
References
-
Supported databases https://learn.netdata.cloud/docs/export/external-databases#supported-databases ↩︎
-
Supported collectors list https://learn.netdata.cloud/docs/agent/collectors/collectors ↩︎
-
Interactable system overview chart of Netdata https://my-netdata.io/infographic.html ↩︎
-
Netdata Team. (2020, september 25). Software Extensibility Is Key To Adoption https://www.netdata.cloud/blog/software-extensibility-is-key-to-adoption/ ↩︎
-
How to optimize the Netdata Agent’s performance https://learn.netdata.cloud/guides/configure/performance ↩︎
-
Tsaousis, C. (2020, july 29). Why Netdata is free https://www.netdata.cloud/blog/why-netdata-is-free/ ↩︎
-
(2022, februari 22). Security design https://learn.netdata.cloud/docs/agent/netdata-security ↩︎
-
(2021, december 14). How to write a Netdata collector in Go https://learn.netdata.cloud/docs/agent/collectors/go.d.plugin/docs/how-to-write-a-module ↩︎
-
OpenAPI Specification https://swagger.io/specification/ ↩︎
-
Netdata API swagger documentation https://editor.swagger.io/?url=https://raw.githubusercontent.com/netdata/netdata/master/web/api/netdata-swagger.yaml ↩︎
-
Uniform Access Principle http://wiki.c2.com/?UniformAccessPrinciple ↩︎