Essay 4: Scalability
When any software project is growing, scalability challenges inevitably arise. Podman does not inherently have a direct scalability problem since it tackles local container orchestration. Many of the obstacles for scalability presented by Hull (2013)1 do not apply to Podman, but we identified some indirect issues. What happens if you start up thousands of containers at once? What is the difference between Docker and Podman in terms of power usage? And is the development team equipped to deal with developer turnover?
Previously we have identified the product context, architectural design, and the quality and evolution of the project. In this essay, we identify which scalability problems are present in Podman and how the contributors deal with these issues. We combine our findings and propose achievable solutions to improve this.
Profiling Podman
Podman is a complex system with hundreds of dependencies and dozens of modules serving different purposes. Inevitably, some of these components get used more than others because of common use case occurrences or architectural decisions. But how does this concretely impact Podman’s performance? And which components are used the most?
To answer these questions, we turn to profiling, a dynamic program analysis method that enables us to track the percentage of time a software system spent in each of its modules. Profiling is an established technology used in research for tasks like monitoring the energy consumption of software and predicting paths in the execution of code.23
In our attempts to profile Podman, we tried three distinct approaches: (1) modifying the source code to inject profiling triggers in various commands, (2) using Podman dependencies independently and profiling them through external Golang scripts, and (3) injecting profiling triggers in the end-to-end tests. Unfortunately, none of these approaches succeeded. The issues were that (1) the compiled binaries with the injected code triggered the profiling sections unpredictably and debugging the compiled binaries is extremely difficult, (2) the Podman libraries are not meant to be used as external dependencies and interfacing with them was not possible due to version incompatibilities, and (3) the end-to-end test framework crashes when interfacing with Golang’s profiler. Our failed attempts to profile Podman raised a trivial question: how valuable is this analysis for Podman?
To investigate this matter, we turned to the repository’s related issues as well as other external resources like blog posts and mailing lists. We conclude that profiling is only employed when developers encounter significant performance issues, as exemplified in issues 11236 and 13226. We could only find one concrete profiling report performed on Podman 1.9.3 by Kunal Kuswaha.4 We use this report as the basis of the following analysis.
The most interesting insight of the report is the relative runtime of particular modules. We observe that the most time is spent in synchronisation tasks (21% of the total runtime), followed by system calls to the Linux kernel (14.6%), sleep operations (11%), and memory allocation (6.4%). These four low-level operations account for over half of the runtime. This means that Podman spends a substantial percentage of the execution in kernel-level operations and synchronisation. This is an excellent sign because it suggests Podman introduces little overhead in the interaction with the host machine. However, it spends over 20% of the runtime in synchronisation tasks and 10% in sleep operations. This raises two questions: why does this happen, and can we improve it?
The main reason behind the runtime distribution of Podman is its Fork/Exec architecture. The diagram below depicts the flow of the application. The parent process of Podman first creates an identical copy of itself (the fork), which then executes the container functionality (the exec). The main process waits for the exit code of its child, after which it resumes execution. This architecture is indispensable to Podman because it provides the security that a shared state client/server alternative could not, but it introduces synchronisation overhead.
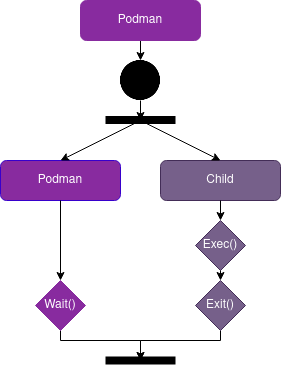
Figure: Fork/Exec model which needs to synchronise.
Podman’s architecture favours security as its key quality attribute, but this comes at a cost. The synchronisation of container operations introduces sizeable overhead as users add more containers to the system, which has a measurable impact on scalability. Because this is inherent to the design of Podman, we think that the best way to mitigate this is to focus on optimisation rather than architectural change. Recent research shows that this is feasible with up to an 80% reduction in process spawn times for multicore architectures.5
Storage performance
Podman benefits from compatibility with OCI standards and its high configurability, as Podman offers plenty of feature flags. For example, the user can select the storage driver for different performance requirements. Podman uses fuse-overlayfs as a workaround for achieving non-root storage IO management, which offers improved security at a slight performance cost. According to this discussion, developers can expect rootless containers to be up to 15% slower than their root-based alternatives. However, users can configure Podman to use the kernel overlayfs in root for better storage performance.
The performance of operating on a container strongly depends on the OCI runtime it uses. Some issues indicate the unfavourable performance of Podman while building containers. Moreover, developers found through experimentation that under heavy workload Podman under-performs compared to other container engines like LXD and Docker.6
Although users could configure Podman with different OCI runtimes that best fit their environment to achieve better performance in their up-scaling use cases, the performance relies on external factors like hardware restrictions. In theory, users can fire up thousands of containers at once, which has a substantial performance impact. Still, in practice, users tend to choose higher-level solutions like Kubernetes or OpenShift for large scale deployment over multiple devices.
Podman can downscale by limiting resources. To run containers under constrained resources, Podman uses the different configuration flags provided by OCI runtimes, such as:
CPU-quota- limits the CPU usage.Memory- limits the bytes of memory that the container can use.PIDs-limit- controls the maximum number of processes run in the container.
By restricting the resources that a running container instance can use, Podman improves its usability for lightweight use cases in small-scale environments.
Power Consumption
Recently awareness of the environmental impact of software and IT is rising. This sentiment can be seen in governmental policies and recently founded organisations like ClimateAction.tech and Green Software Foundation. Their goal is to promote sustainable and climate-responsible behaviour within the IT sector. The Paris Climate Agreement dictates to reduce Green House Gas emissions by 45% by 2030 within the IT sector.7
Podman and other container tools have a massive impact as companies deploy containers to cloud environments that serve customers worldwide. It is hard to estimate the number of running containers in cloud services, but DataDog investigated its many customers who run 1.5 billion containers 8. Given that many other cloud providers exist, the actual number can be exponentially larger. Hence, we decided to explore the power efficiency of Podman and compare it to native runtime and Docker. Companies can benefit monetarily from more efficient container solutions because of lower consumption expenditures.
For our analysis, we decided to measure the number of kWh produced when running a container that loops and prints the numbers from 1 to 100,000 to simulate the power consumption per popular high-level languages, which we run multiple times with breaks. We compared running these scripts as a baseline without any container engine and inside Podman and Docker containers. To perform the measurements, we used PowerTOP on an Ubuntu 20.04 VM as suggested on Linux based systems.9 We are interested in the average power consumption of a continuous use case and therefore measure power rather than energy.
We hypothesised that Podman would be more efficient than Docker in power consumption. As mentioned in Essay 1, Podman’s daemonless architecture is more efficient as it does not use this extra background process to run and manage containers that Docker uses. We performed an analysis to test the legitimacy of this theory.
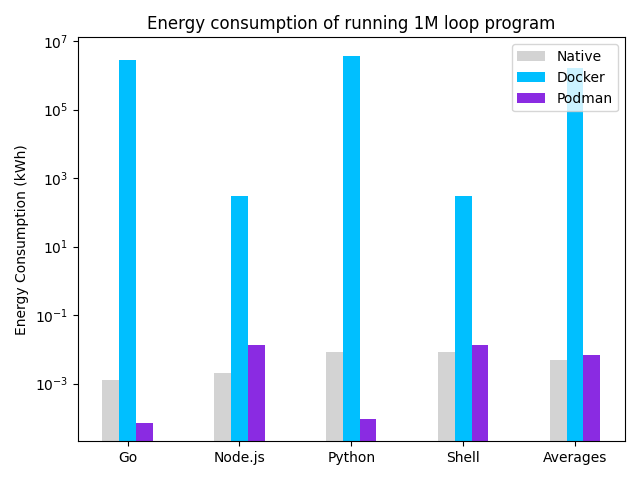
Figure: Power Consumption for running a 1M loop.
| Run Time | Language | Power (kWh) |
|---|---|---|
| native | golang | 0.00126348 |
| native | node | 0.00201401 |
| native | python | 0.00850836 |
| native | shell | 0.00828184 |
| docker | golang | 2.77352e+06 |
| docker | node | 306.814 |
| docker | python | 3.75692e+06 |
| docker | shell | 306.808 |
| podman | golang | 7.09657e-05 |
| podman | node | 0.0137856 |
| podman | python | 8.93415e-05 |
| podman | shell | 0.0132177 |
The results in the graph and table above suggest that our hypothesis was correct. Podman seems, on average, to consume more power than a ‘native’ run without containers but seems to consume less power than Docker. We can conclude that Podman is more power-efficient than Docker, and it seems to have an insignificant increase compared to a native-run. Interestingly, Go and Python are more efficient on Podman than natively. Podman is written in Go and therefore has minimal latency and power consumption, and the Python image that was downloaded was smaller than a native installation which required running fewer processes and hence is more efficient.
Investigating the power logs, we found that, on average, the daemon adds an extra 262 mW. Additionally, we observed that Docker runs another process for each built container when idle, which adds, on average additional 44.8 mW. The results can be recreated by running the following code. An improvement to this experiment would be to run increasingly complex software systems natively and in containers.
Social downscale
Podman has an active group of core contributors that steer the project forward, but what happens if one of the members suddenly leaves? This phenomenon, called social downscale, influences any project that lasts years. This relates to the knowledge that core contributors hold, which is lost if a maintainer stops for any reason to contribute or aid the current development.1011
In the following figure, we show the result from the social analysis from CodeScene.12 It displays a critical aspect of the social behaviour of Podman: almost all the code is written by a small group of contributors that are all still actively working on it.
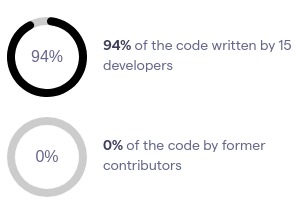
Figure: Knowledge distribution of Podman
In the following figure, we show the number of contributors per month over the lifetime of Podman until March 2022. Initially, we see an upward trend, which indicates a growing community, while from early 2021, a decreasing trend started. This potentially means that the community is shrinking, indicating that knowledge loss can be introduced if core contributors would also leave.
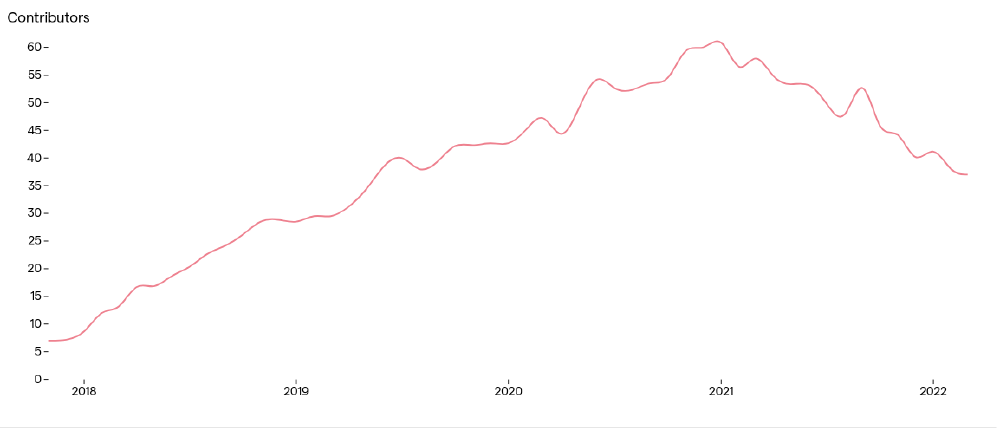
Figure: Active contributors to the Podman repository per month.
This raises the question of whether Podman is prepared to take over all the various parts of the project if a contributor leaves. In other words: is Podman ready to downscale if necessary? We display the knowledge islands according to the CodeScene analysis in the following figure. Yellow and red display knowledge islands, which are parts of the codebase where potential knowledge loss can occur. We cannot conclude any area of Podman is primarily affected. However, the possible knowledge loss is distributed throughout the whole project in various modules.
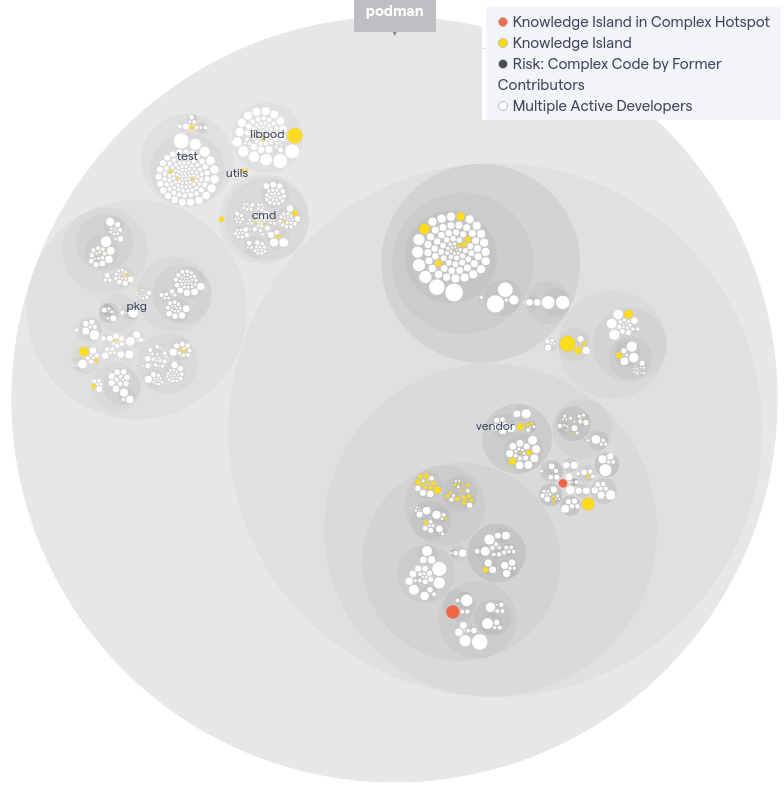
Figure: Knowledge hotspots of Podman
Since only a small group of contributors write the gross of the project, Podman needs to be aware of the contributor trends and knowledge loss that can occur because of this. Therefore, Podman could introduce a more thorough and personal analysis to identify which components require knowledge sharing to prevent potential loss.
Conclusion
Overall, Podman scales well thanks to its inherent architectural style that does not directly face many scalability issues. We did identify some external aspects by using a profiling analysis to identify essential and frequently used components, including a more thorough examination of the storage scaling. We also performed a power consumption analysis comparing a containerless implementation against Podman and Docker. Finally, we conducted social behaviour analysis indicating that knowledge loss might occur presently.
We believe that these external scalability issues might still pose a problem for the future stability of the project and therefore recommended solutions that can improve these components, such as synchronisation optimisation and a knowledge transfer procedure.
This concludes our four-part essay endeavour where we analysed the Podman project from critical architectural perspectives. We identified Podman’s vision, the strength and weaknesses of its current implementation, and proposed solutions to improve the overall quality of the project. This project has changed our understanding and usage of containers for the better. #nobigfatdeamons
References
-
Sean Hull. (2013). “20 Obstacles to Scalability”. Communication ACM, v. 56, pp. 54–59. ↩︎
-
Schubert, S., Kostic, D., Zwaenepoel, W., & Shin, K. G. (2012, November). Profiling software for energy consumption. In 2012 IEEE International Conference on Green Computing and Communications (pp. 515-522). IEEE. ↩︎
-
Duesterwald, E., & Bala, V. (2000). Software profiling for hot path prediction: Less is more. ACM SIGARCH Computer Architecture News, 28(5), 202-211. ↩︎
-
Kunal Kushwaha. (2018). Podman performance test program. Retrieved on March 25, 2022, from https://gist.github.com/kunalkushwaha/4504487b0b43dbbe1421069cd50eb08c. ↩︎
-
Kulkarni, A., Ionkov, L., Lang, M., & Lumsdaine, A. (2013). Optimizing process creation and execution on multi-core architectures. The International journal of high performance computing applications, 27(2), 147-161. ↩︎
-
Espe, Lennart & Jindal, Anshul & Podolskiy, Vladimir & Gerndt, Michael. (2020). Performance Evaluation of Container Runtimes. 273-281. 10.5220/0009340402730281. ↩︎
-
IISD’s SDG Knowledge Hub. (2020, March 24). Report helps ICT sector set science-based targets on climate change: News: SDG knowledge hub: IISD. SDG Knowledge Hub. Retrieved March 27, 2022, from https://sdg.iisd.org/news/report-helps-ict-sector-set-science-based-targets-on-climate-change/ ↩︎
-
Datadog. (2021, October 12). Datadog. 10 trends in real world container use. Retrieved March 27, 2022, from https://www.datadoghq.com/container-report/ ↩︎
-
Luis Cruz. (2021). “Tools to Measure Software Energy Consumption from your Computer”. Blog post. Retrieved on March 22, 2022, from http://luiscruz.github.io/2021/07/20/measuring-energy.html ↩︎
-
M. Rasid, P.M. Clarke, R.V. O’Connor. (2019). “A Systematic Examination of Knowledge Loss in Open Source Software Projects”, International Journal of Information Management, v. 46, pp. 104-123. ↩︎
-
D. Izquierdo-Cortazar, G. Robles, F. Ortega and J. M. Gonzalez-Barahona. (2009). “Using Software Archaeology to Measure Knowledge Loss in Software Projects Due to Developer Turnover,” Hawaii International Conference on System Sciences, v. 42, pp. 1-10. ↩︎
-
CodeScene Knowledge Distribution documentation. (2021). Retrieved on March 22, 2022, from https://codescene.io/docs/guides/social/knowledge-distribution.html ↩︎