This final essay describes the scalability of Netdata, its scalability challenges, and its scalability solutions. From the insights we gained while writing Essay 1, we could already see that scalability is one of Netdata’s key quality attributes. Because of this, scalability lies at the heart of Netdata’s infrastructure, and it is kept in mind throughout the development. In Essay 2 we learned that there are numerous architectural decisions made to ensure the scalability of Netdata, in line with Netdata’s vision to provide scaling at marginal costs1. In this essay we will discuss the various ways in which Netdata can be scaled, discussing the challenges, solutions, and in some cases proposed architectural changes to overcome these challenges.
For this essay we have decided to deviate from the proposed structure. The main issue we had to deal with was that the Netdata architecture is already designed with scalability as a main key quality attribute in mind, making both testing the borders of its scalability and suggesting improvements for scalability issues arguably infeasible. A realistic scalability issue would probably lie in the realm of running multiple servers or hundreds of VMs trying to collect data while running other tasks in addition to Netdata, and we had neither the time nor resources to quantitatively analyze such a situation.
Instead of looking at the system as a whole and describing each requested talking points, we decided to look at the main scalability areas of Netdata. For each of these areas we discuss (if possible) the suggested points. We chose for this approach because we think that it serves well to give an overview of the architectures limitations when it comes to scalability, and through this manage to still make some suggestions where the current architecture could be improved.
Scaling features
The first thing that comes to mind when thinking about scaling in Netdata, is scaling the number of features. This includes any sort of addition to the source code, like adding a new collector, alarm, or supported database. Adding new features however does come at a cost, as these new features increase the size of the program. This can affect the CPU utilization and response time of the program, which goes against Netdata’s vision2.
To see the actual affect that scaling the number of features has on the system, we decided to run Netdata with and without the diskspace plugin enabled. This plugin monitors the disk space usage of mounted disks3 and collects a total of 40 metrics. We than used Netdata’s build-in CPU utilization monitoring functionality, which displays the CPU usage in nanoseconds, to compare the two situations. The results of this experiments can be seen in the pictures below, where it becomes clear that running Netdata without the diskspace plugin lowers the CPU utilization from a maximum of 12.3 to 9.7 nanoseconds. This method can also be used by developers, to see the impact of their newly added feature.
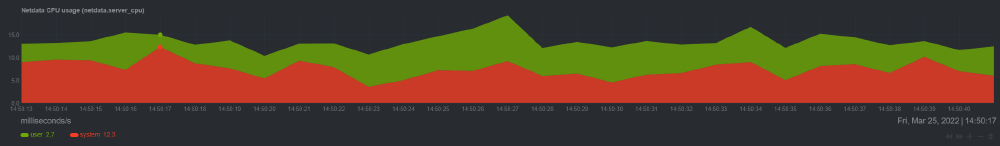
Figure: Netdata CPU usage all plugins enabled, 1903 metrics

Figure: Netdata CPU usage with diskspace plugin disabled, 1863 metrics
To limit the performance impact of newly added features, Netdata has made some architectural decisions together with some strict guidelines. For starters, Netdata has designed an interface for its collectors4, allowing only useful metrics to be collected5. Next to this, the agent of Netdata is written in C to keep it optimized. Besides these architectural decisions, the Netdata company has also set up some rules to maintain the performance. Newly added features may only collect useful metrics and the performance of this feature needs to be oké6, deviating from these rules will result in the rejection of the pull request.
Besides these measures, we think that one more addition could even further improve the scalability of the features Netdata. This addition is in the form of an additional check, which checks if the CPU utilization of Netdata is still below the strived at 1%. If this is not the case, then Netdata can automatically scale down the metric collection resolution or turn of some collectors, based on the configuration file. Here the user can mark the importance of the collectors, so that Netdata will only turn off the less important collectors. The picture below shows a sketch of the old and new situation, where we can see that it will keep scaling down until the CPU utilization is again 1%. To get the current CPU utilization Netdata uses the getrusage7 function. Due to a lack of time, we were not able to implement this new functionality. We are however confident that this is only one approach and that there are more ways to improve the scalability in this area.
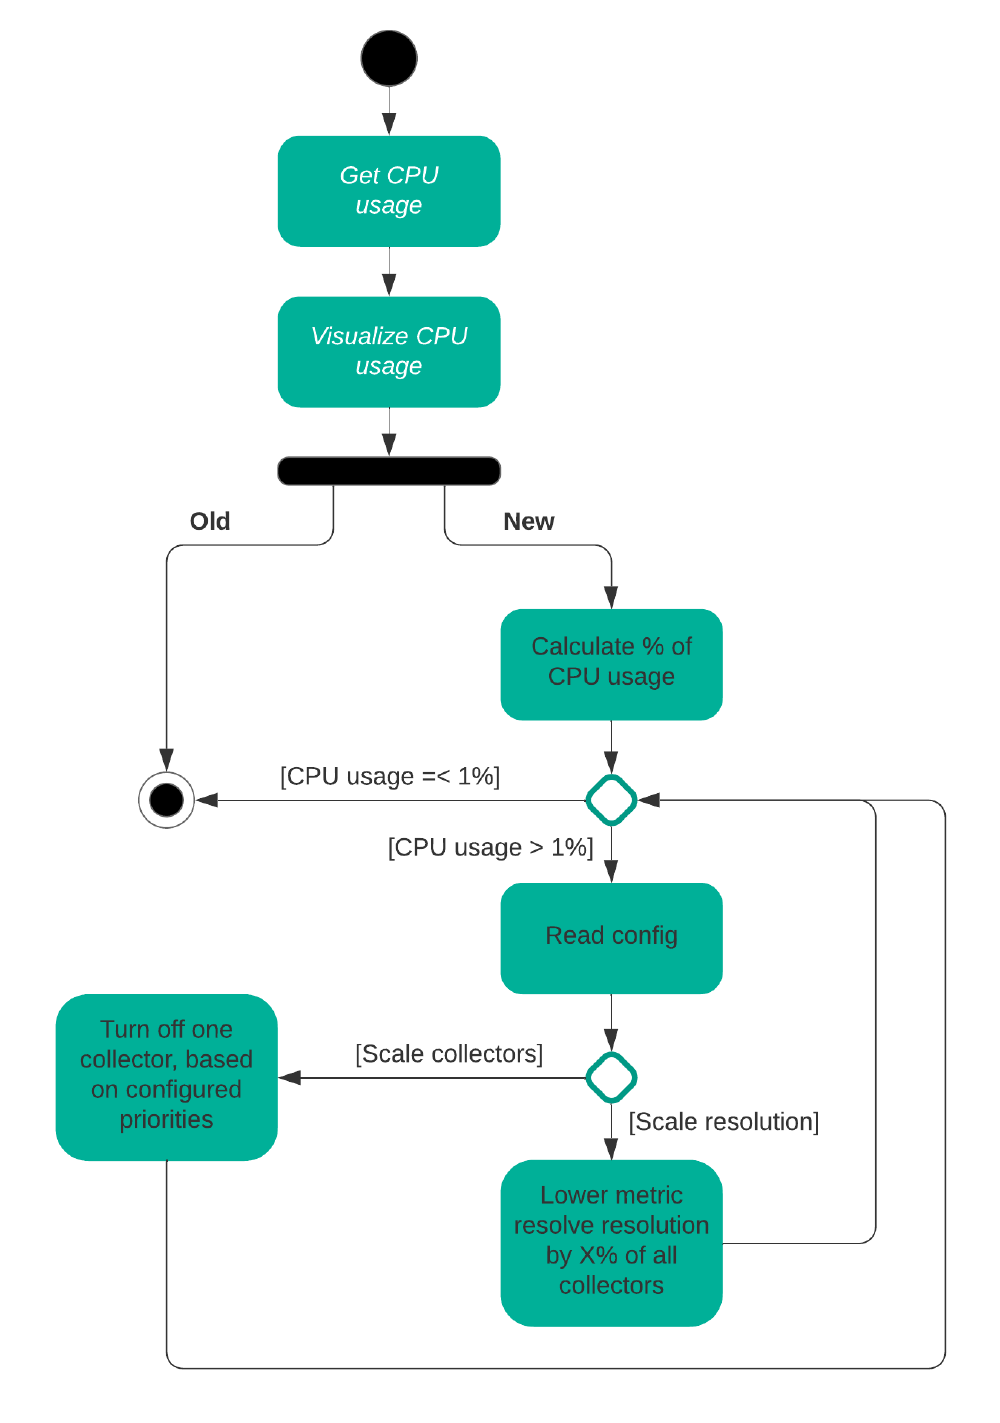
Figure: Netdata collector scaling proposed solution
Scaling the number of nodes
One of the other dimensions in which Netdata can scale is the number of nodes. Netdata Cloud can be used to connect distributed nodes, from which entire infrastructures of nodes can be monitored. The most down-scaled scenario of this dimension is when there is only one node monitored. The most up-scaled scenario is when there are infinitely many nodes connected to each other.
Single node monitoring
For single node monitoring, the highly configurable8 Netdata agent collects metrics from applications or containers running on a single node. These real-time metrics can be visualized in multiple ways. One way is by accessing the local dashboard that is running on the node9. Furthermore, Netdata Cloud can be used, which also offers real-time, interactive, and synchronized charts, with the same metrics, and uses the same UI. Additionally, Netdata Cloud provides extra features, like creating new dashboards using a drag-and-drop editor10.
Multi node monitoring
New nodes can be added to the existing infrastructure, by installing a Netdata agent on it and connecting it with Netdata Cloud. Another way of connecting nodes is by using the “visited nodes” tab on the local dashboard11. The infrastructure of these connected nodes can be adjusted by the user, for example by adding nodes, removing nodes, or splitting the network. Furthermore, the nodes for which the metrics are shown can be adjusted and how the data is aggregated (e.g., sum, avg, max, etc.). Every node also has its own node view, where the highly granular data of that node is shown12. The number of nodes that can be used is independent of the hardware and resources of each node. Netdata does not have an upper bound on how many nodes can be used in a network.
Scalability Issues under Constrained Resources
There is also the case of running Netdata on resource-constrained devices, such as an embedded devices or small virtual machines, bringing different challenge to the architecture. In this situation, both the CPU and memory (RAM and Disk memory) resources may be rare. Despite Netdata’s defaults settings of per-second collection and retention of up to 2000 data metrics and other features, the configurability of the system allows users to decide exactly how important the data collection is. Here the architecture allows to trade off scalability against almost every other feature that is being provided.
The Netdata agent itself can consume a modest 5% of the CPU on a standard Raspberry Pi device, and its default database setting allows for roughly 256MB of disk and 100MiB of RAM6 to store up to one hour of metrics, down to a minimum of only 64MB RAM dependent on the page caching and database configuration. Below this minimum we consider the idea of using Netdata unfeasible.
Collectors and Database
The system must manage the data collection, database management, and the observability of the system through the local dashboard. The data collectors are run at the lowest priority allowed by the kernel and can also be turned off per collector group or per individual collector. Similarly, the rate at which metrics are collected is fully configurable and determines the total disk and CPU load of both the database and collector.
This prioritizes the scalability of this system in favor of its functionality as a data collector and would be a beneficial architectural choice with respect to scalability. Furthermore, whether the database is stored on disk at all, the compression rate of the database and its general database strategy are all tradeoffs the user is allowed to make in favor of scalability, as described in the user guides 13. This makes the collection and storage of metrics as scalable as possible in this architecture if the user is willing to trade off other aspects.
Local Dashboard
Trading observability of the node for scalability is more difficult. The local dashboard also uses resources, primarily RAM and CPU, and is affected by the number of external users. The solutions provided for this are to run the dashboard itself on a dedicated server or to disable the gzip compression to increase load on the web clients in favor of the load on the server.
We would propose a different solution that already exists within Netdata’s architecture itself: A collect-and-forward observer node. Netdata can already open a network pipeline directly to another Netdata node, which could be running on a less constrained platform such as a dedicated server, and directly forward its collector data as a collector input to another node14, where it can be treated as an external data collector. This proposed functionality can also be seen in the picture below.

Figure: Netdata minimalist collect-and-forward Architecture proposal
Minimum functionality for this would only need the Daemon, Collectors, and streaming components. A slightly more self-contained version still uses the Database and Health components to locally store and perform health and alarms checks, allowing alarm notifications and less dependency on a good network connection to ensure data continuity to the parent node. The parent node would then run a full scale Netdata agent and be able to display both nodes’ metrics without affecting the resource use of the child node[14.
Conclusion
Looking at these three scalability areas of Netdata, there is only one thing we can conclude. Netdata is very scalable, providing various architectural solutions that overcome the challenges of scalability. Its main strength in this aspect is that the configurability aspects of the architecture serve to empower users to trade off scalability against almost every other key quality attribute. Scalability has clearly always been one of the most important key quality attributes of Netdata, as it is designed from the start to be very scalable in multiple areas.
Finally, we would also like to address that in any realistic scenarios, in looking through the past and current issues with respect to scalability, there were two common points to these issues and their solutions. When Netdata causes a relatively high system load, it is a result of an implementation fault that undermined the scalability of the architecture. When the system experiences outage, due to the over usage of resources, it is mostly because another task is overloading the system, while Netdata is still collecting and displaying data until the system collapses.
This latter situation is realistically the most common: a proper lightweight system monitor can be expected to perform at much smaller load than the processes it is observing, and when scalability on the system as a whole is causing issues, it is the resource demands of these other processes that heavily outweigh the demands of the observer process.
References
-
The Netdata Way of Troubleshooting https://www.netdata.cloud/netdata-way/ ↩︎
-
How to optimize the Netdata Agent’s performance https://learn.netdata.cloud/guides/configure/performance ↩︎
-
diskspace.plugin https://learn.netdata.cloud/docs/agent/collectors/diskspace.plugin ↩︎
-
How to write a Netdata collector in Go https://learn.netdata.cloud/docs/agent/collectors/go.d.plugin/docs/how-to-write-a-module ↩︎
-
Meaningful metrics https://learn.netdata.cloud/contribute/handbook#meaningful-metrics ↩︎
-
Performance and efficiency https://learn.netdata.cloud/guides/configure/performance ↩︎
-
Get resource usage https://man7.org/linux/man-pages/man2/getrusage.2.html ↩︎
-
Single-node monitoring with Netdata https://learn.netdata.cloud/docs/quickstart/single-node ↩︎
-
How the dashboard works https://learn.netdata.cloud/docs/dashboard/how-dashboard-works ↩︎
-
Visualization’s overview https://learn.netdata.cloud/docs/cloud/visualize/overview ↩︎
-
Monitor more than one system with Netdata https://learn.netdata.cloud/guides/step-by-step/step-03 ↩︎
-
Infrastructure monitoring with Netdata https://learn.netdata.cloud/docs/quickstart/infrastructure ↩︎
-
Effects of different settings on the database size https://learn.netdata.cloud/docs/store/change-metrics-storage#calculate-the-system-resources-ram-disk-space-needed-to-store-metrics ↩︎
-
Enable streaming between nodes https://learn.netdata.cloud/docs/metrics-storage-management/enable-streaming ↩︎